


The Air quality in Europe – 2016 report
j F Y in In Evidenza
The Air quality in Europe – 2016 report
EEA Air quality in Europe 2016 report
Health impacts of exposure to fine particulate matter, nitrogen dioxide and ozone
The health impacts of air pollution can be quantified and expressed as premature mortality and morbidity. Mortality reflects reduction in life expectancy owing to premature death as a result of air pollution exposure, whereas morbidity relates to occurrence of illness and years lived with a disease or disability, ranging from subclinical effects to chronic conditions that may require hospitalisation. Even less severe effects might have strong public health implications, because air pollution affects the whole population on a daily basis, especially in major cities where concentrations tend to be higher than in rural areas (with the exception of ozone). Most of the evidence on the health impacts of pollution tends to focus on premature mortality, as well as respiratory, cardiovascular and cerebrovascular effects attributed to exposure to air pollution (WHO, 2008, 2013b), but evidence also exists of a range of other effects. The health impacts from air pollution can be estimated using different health outcomes (Box 10.1). The health impacts estimated for this report are those attributable to exposure to PM2.5, NO2 and O3 in Europe for 2013 (41).
This assessment required information on air pollution, demographic data and the relationship between exposure to ambient pollutant concentrations and a health outcome. The maps of air pollutant concentrations (annual mean concentration for PM2.5 and NO2, and SOMO35 for O3; ETC/ACM, 2016b) are based on the Air Quality e-Reporting Database (EEA, 2016a) monitoring data measured at regional and urban background stations in 2013, auxiliary information, such as meteorological data, and concentrations modelled with the EMEP chemical dispersion model. The demographic data and the health-related data were taken from the United Nations (UN, 2015) and the WHO (2016), respectively. The exposure–response relation and the population at risk have been selected in accordance with the recommendation given by the Health Risks of Air Pollution in Europe (HRAPIE) project (WHO, 2013b). For PM2.5, impacts have been estimated for the full range of observed concentrations, meaning all PM2.5 is considered, even that of natural origin; for NO2, impacts have been estimated for levels above 20 μg/m3 (42). A further description and details on the methodology are given by the ETC/ACM (2016c).
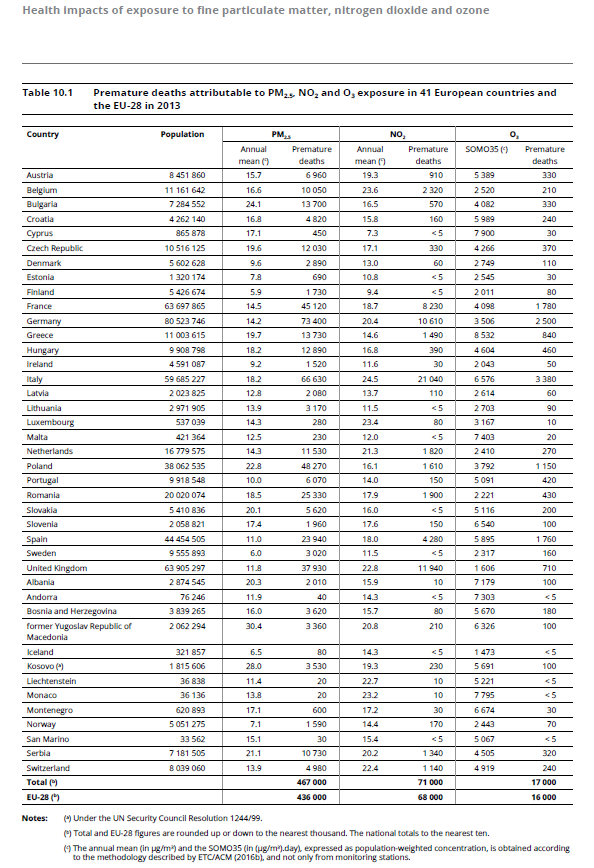
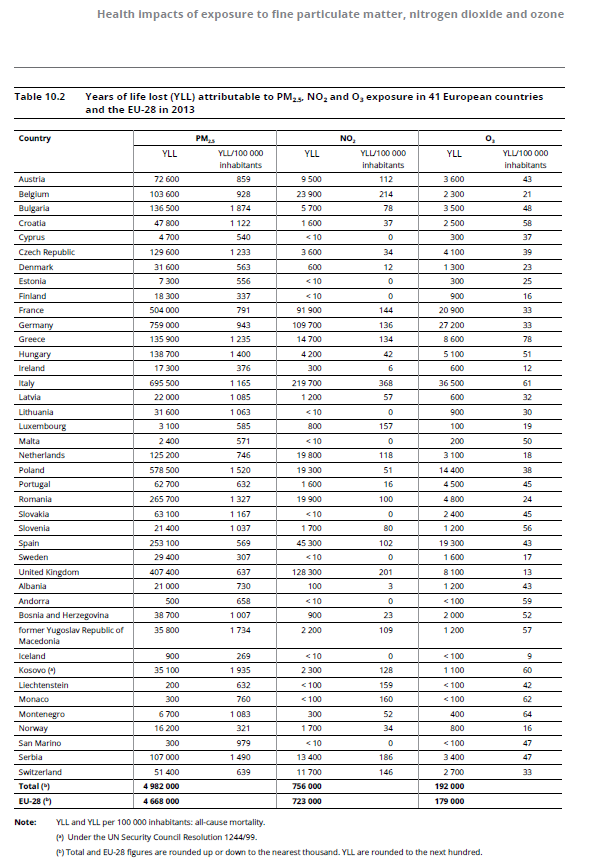
The results of the health impact assessment are presented in Tables 10.1 and 10.2 for 41 European countries, for the 41 counties as a whole (‘Total’) and for the EU‑28. Table 10.1 presents, for each pollutant, the population-weighted concentration and the estimated number of premature deaths, in addition to the population for each country for comparison between countries. In the 41 countries listed, 467 000 premature deaths are attributed to PM2.5 exposure, 71 000 to NO2 exposure and 17 000 to O3 exposure. In the EU‑28, the premature deaths attributed to PM2.5, NO2 and O3 exposure are 436 000, 68 000 and 16 000, respectively (43). Table 10.2 presents the estimated number of years of life lost (YLL) and the YLL per 100 000 inhabitants due to exposure to PM2.5, NO2 and O3 in Europe for 2013. In total, in the 41 countries assessed, 4 982 000 YLL are attributed to PM2.5 exposure, 756 000 YLL to NO2 exposure and 192 000 YLL to O3 exposure.
In the EU‑28, the YLL attributed to PM2.5, NO2 and O3 exposure are 4 668 000, 723 000 and 179 000, respectively (44). For PM2.5, the highest numbers of YLL are estimated for the countries with the largest populations (Germany, Italy, France and the United Kingdom). However, in relative terms, when considering YLL per 100 000 inhabitants, the largest impacts are observed in the central and eastern European countries where the highest concentrations are also observed, i.e. Kosovo under the UN SCR 1244/99, Bulgaria, the former Yugoslav Republic of Macedonia, Poland, Serbia, Hungary, Romania, Greece, the Czech Republic and Slovakia.
The largest health impacts attributable to NO2 exposure are seen in Italy, the United Kingdom, Germany and France. When considering YLL per 100 000 inhabitants, the highest rates are found in Italy, Belgium, the United Kingdom and Serbia. Regarding O3, the countries with the largest impacts are Italy, Germany, France, Spain and Poland; and the countries with the highest rates of YLL per 100 000 inhabitants are Greece, Italy, most of the countries in the Western Balkans and Hungary. The impacts estimated for each pollutant may not be added to determine the total impact attributable to exposure to these three pollutants, because concentrations are (sometimes strongly) correlated. This may lead to a double counting of up to 30 % of the effects of PM2.5 and NO2 (WHO, 2013b). This possible double counting has not been corrected for. Variations from one year to another are proportional, in the case of PM2.5, to the changes in population and weighted-population concentrations. This is not the case for NO2, for which only concentrations above 20 μg/m3 are considered. In this case, the most determining factor is the percentage of the population exposed to levels above 20 μg/m3.