


Inter-Comparison of carbon content in PM2.5 and PM10 fractions collected at five measurement sites in Southern Italy
j F Y in Uncategorized
From November 2015 to January 2016 a field campaign was performed simultaneously at five measurement sites in Southern Italy, four of which are regional stations of I-AMICA network (www.i-amica.it). The study, published on Atmosphere [2], aimed to characterize the different spatial distribution of the carbonaceous content in PM10 and PM2.5 atmospheric aerosol. The measurement sites (Figure 3.1) were Lecce, Lamezia Terme, Capo Granitola, Monte Curcio and Naples.
The first four sites are regional stations of the Global Atmosphere Watch program (GAW-WMO). Each site, with different characteristics, was classified on the basis of distance from pollution sources: Naples urban site, Lecce suburban, Lamezia Terme and Capo Granitola coastal/marine sites and Monte Curcio remote location. PM10 and PM2.5 measurements were performed using the β-ray attenuation method, with a low volume samplers (2.3 m3/h) with two channels for automatic sampling and monitoring (SWAM 5a Dual Channel Monitor-FAI Instruments). The particulate matter was collected on quartz microfiber filters (Whatman Q-grade, diameter 47 mm), pre-fired for 2 h at 700°C in order to remove any residual carbon contamination. The analysis of Total Carbon TC = OC + EC (OC organic carbon and EC elemental carbon) was performed by the thermo-optical method (TOT) using a Sunset Laboratory OC/EC analyser (Sunset Laboratory, Tigard, OR, USA), implementing the EUSAARII temperature protocol.
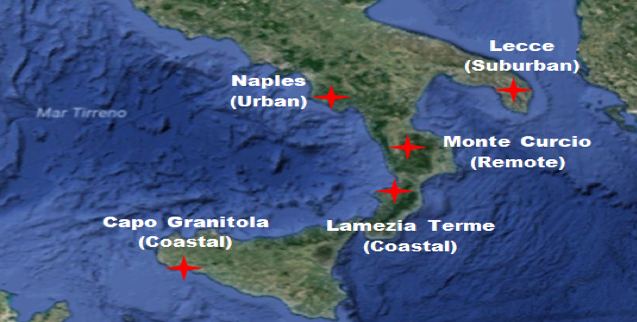
Fig. 3.1) Map of Southern Italy with the observation sites
The higher PM10 and PM2.5 mass concentration values were observed in the urban site of Naples (50.8 ± 21.7 and 37.8 ± 18.0 μg/m3), followed by Lecce (32.7 ± 13.0 and 25.7 ± 11.6 μg/m3), Capo Granitola (23.2± 8.6 and 10.4 ± 2.6 μg/m3), Lamezia Terme (10.1 ± 3.8 and 7.2 ± 3.5 μg/m3) and Monte Curcio (3.4 ± 1.4 and 3.0 ±1.2 μg/m3). The PM2.5/PM10 average ratios ranged between 0.68 and 0.82 and show that more than 68% of the PM10 is in the form of PM2.5. Moreover, PM10 and PM2.5 concentrations were well correlated at sites of Lecce (R2 = 0.98), Naples (R2 = 0.95) and Lamezia Terme (R2 = 0.88) indicating that the two fractions are driven by similar sources and controlled by common processes. A slightly lower correlation (R2 = 0.77) was found at the Monte Curcio site with a PM2.5/PM10 average ratio of 0.82 that shows the predominant contribution of the fine fraction likely due to long-range transport.
The results of TC, OC and EC mass concentrations are summarized in Tables 3.1 and 3.2. The average OC mass concentrations, contained in the PM10 and PM2.5 fractions ranged, respectively, from 0.9 μg/m3 to 12.8 μg/m3 and from 0.9 μg/m3 to 11.8 μg/m3, while the average EC mass concentrations ranged from 0.06 μg/m3 to 2.3 μg/m3 (in PM10) and from 0.05 μg/m3 to 1.8 μg/m3 (in PM2.5) indicating the high spatial variability between remote and urban site. The highest OC and EC average values were observed in the sites of Naples and Lecce, more affected by primary emissions of anthropogenic sources and characterized by high levels of volatile organic compounds that favour the production of secondary organic aerosol (SOC) under favourable meteorological conditions. Lower values were found in Lamezia Terme and Capo Granitola not only because of relatively limited sources but even because the two sites are influenced by sea-breeze effects that favour the pollutant’s dispersion. The low concentrations measured in Monte Curcio are in good agreement with free tropospheric conditions characterizing a remote site. The higher TC percentage in the PM fractions (TC/PM) were found in Lamezia Terme (48% and 67%) followed by Lecce (35% and 40%), Naples (31% and 39%) and Monte Curcio (30% and 33%), while very low percentages were found in Capo Granitola (13% and 17%), in the PM10 and PM2.5 fractions, respectively.
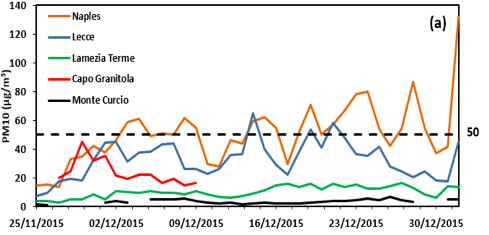
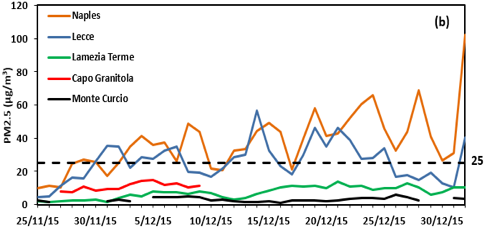
Fig. 3.2) Temporal variability of (a) PM10 and (b) PM2.5 mass concentrations during the measuring campaign at each observation site. Horizontal dashed lines represent the legislative limit values set in Directive 2008/50 and suggested by WMO.
Table 3.1) TC, OC, EC, and SOC average concentrations (±STD) in PM10 together with the OC/EC, TC/PM, OC/PM, EC/PM and SOC/PM average ratios, for each observation site.
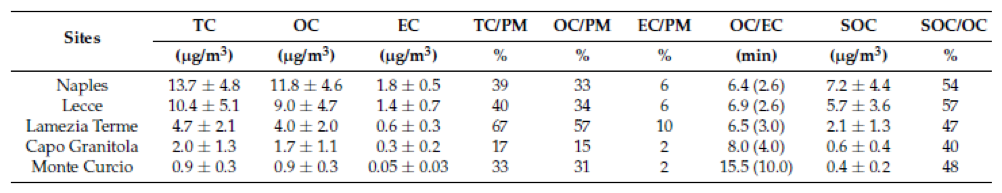
Table 3.2) TC, OC, EC, and SOC average concentrations (±STD) in PM2.5 together with the OC/EC, TC/PM, OC/PM, EC/PM and SOC/PM average ratios, for each observation site.
The OC/EC ratio was used to quantify secondary organic aerosol (SOA) that can be produced into the atmosphere by volatile organic compounds (VOC) oxidation. As summarized in Tables 3.1 and 3.2, the average SOC concentrations ranged from 0.4 to 7.6 μg/m3 in PM10 and from 0.4 to 7.2 μg/m3 in PM2.5, accounting from 37 to 59% of the OC in PM10 and from 40 to 57% in PM2.5. These results show that SOC particles are an important component of the PM mass in all sampling sites. In particular, the higher percentage of SOC observed at Naples and Lecce, can be attributed to the increased emission of volatile organic precursors that together with the stable atmospheric conditions and the prolonged residence time may strengthen atmospheric oxidation of volatile organic compounds.
[2] Inter-Comparison of Carbon Content in PM2.5 and PM10 Collected at Five Measurement Sites in Southern Italy, Dinoi, A., Cesari, D., Marinoni, A., Bonasoni, P., Riccio, A., Chianese, E., Tirimberio, G., Naccarato, A., Sprovieri, F., Andreoli, V., Moretti, S., Gullì, D., Calidonna, C.R., Ammoscato, I., Contini, D., 2017, Atmosphere 8, 243, http://dx.doi.org/10.3390/atmos8120243.
